
Share This


At Strategic Objectives, we’re always on a mission to tell better stories for our clients. Stories that cut through the clutter with relevant, credible news and information consumers can use and share to build positive brand awareness and tell fact-based stories that make good news. Great visuals are key to drawing eyeballs to stories and that’s why we value infographics as an easy way to break down complex data
Why Visuals?
We’ve all heard that a picture’s worth a thousand words, right? Here’s why: science tells us our brain is equipped to take in visual information, and that 65% of the population are visual learners. In fact, people are 30 times more likely to read an infographic than a text article; and reporters pay more attention to stories with strong visuals.
Strategic Objectives has produced numerous, news-generating infographics over the last year and we’re SO proud to showcase a few of them here:
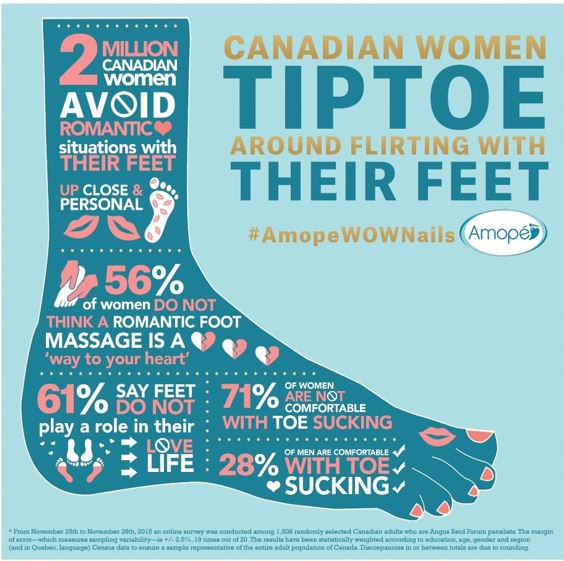
Amopé Love Your Feet. Love Yourself.
To build awareness, acceptance and demand for Amopé, Canada’s #1 foot file, Strategic Objectives conducted original research that revealed 36% of Canadian women don’t like their feet, and nearly 2 million Canadian women avoid situations that require their feet to be up close and personal, due to lack of confidence in the way their feet look and feel. We created this infographic to get that info across, in combination with a national mainstream and social media relations program starring Canadian supermodel Coco Rocha, the perfect ambassador to inspire women to love their feet and feel confident with every step. Check out our Coco case study here.
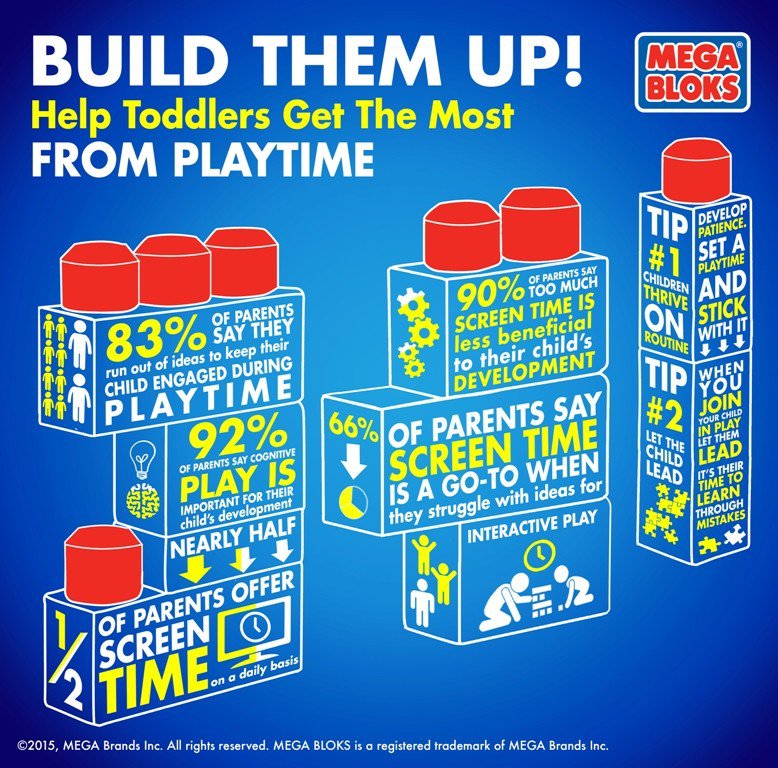
Mega Blocks: Build Them Up!
Mega Blocks, a proud Canadian company known for its chunky building blocks and contribution to early childhood education, wanted to demonstrate the positives of real world playtime versus screen time for children. We produced this infographic to prove the crucial connection between playtime and physical and cognitive development for kids.
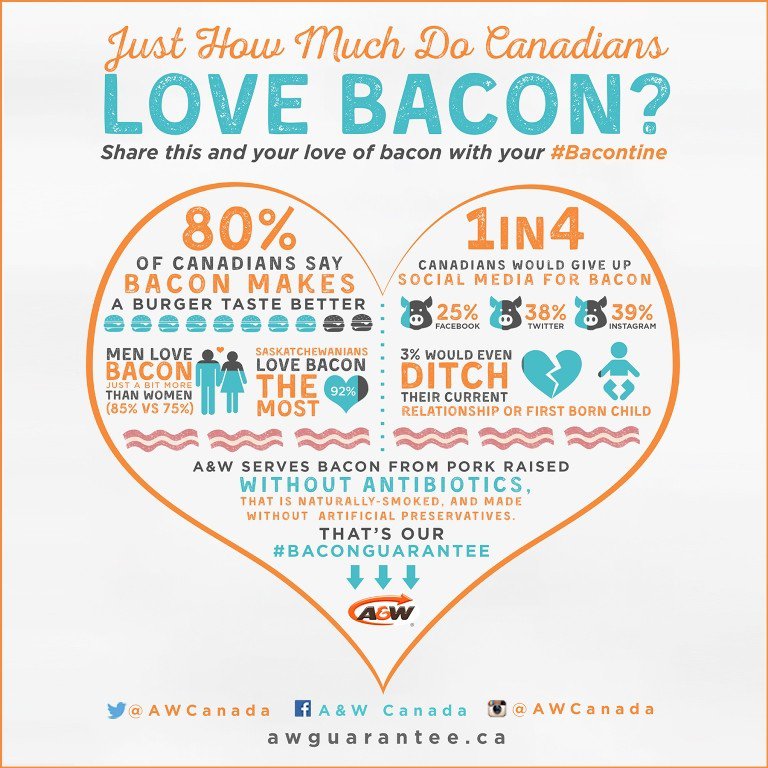
A&W: Just How Much Do Canadians Love Bacon?
We created this infographic to illustrate Canadians’ love of bacon and to highlight A&W Canada’s new #BaconGuarantee – to use pork products produced without antibiotics.
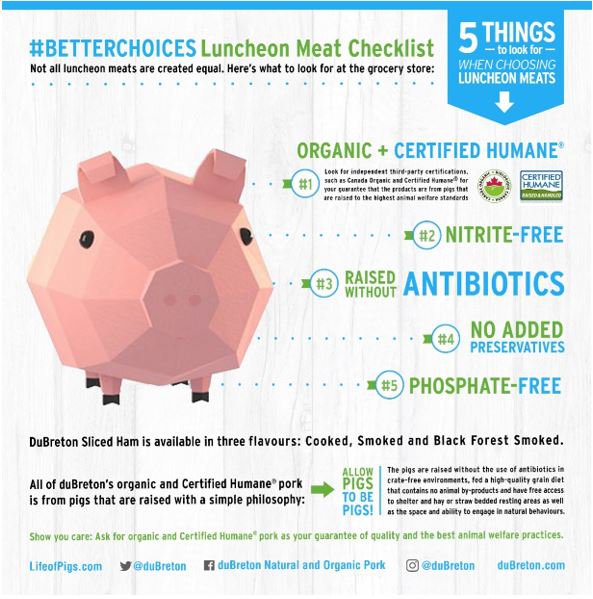
Dubreton: 5 Things to Look for When Choosing Luncheon Meats
Dubreton, Canada’s leading producer of organic and Certified Humane pork wanted to inspire North American grocery shoppers to look beyond the label for truthful human health and animal welfare information. We created this infographic to tell their story and to elevate and differentiate the brand above its conventional, mainstream competition.
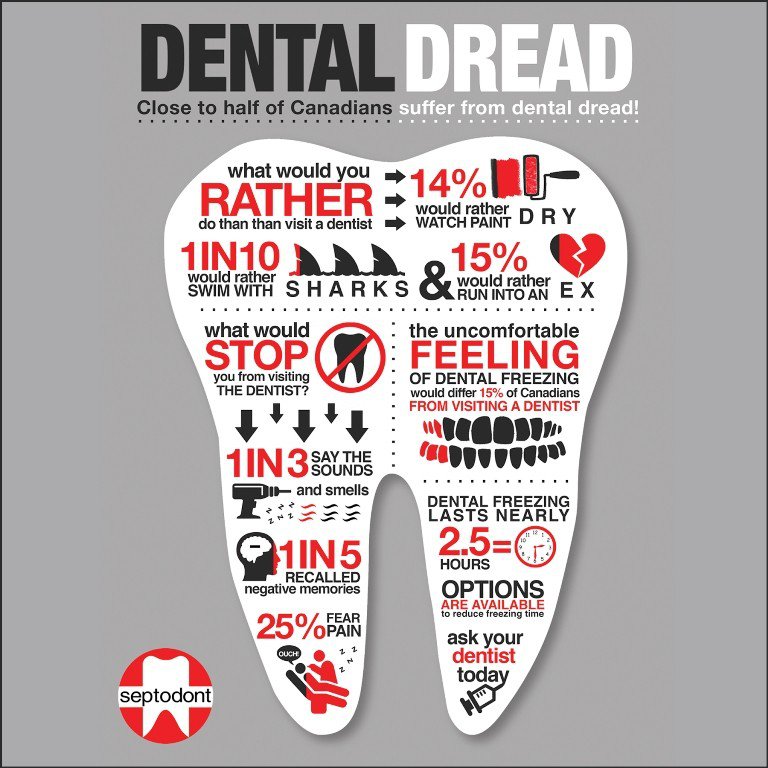
Dental Dread: Close to Half of Canadians Suffer from Dental Dread!
Did you know that 1 in 10 Canadians would rather swim with sharks than go to the dentist? Who knew?! We created this infographic for Septodont, a pain and dental hygiene manufacturer, to demonstrate new advances in dental freezing techniques.
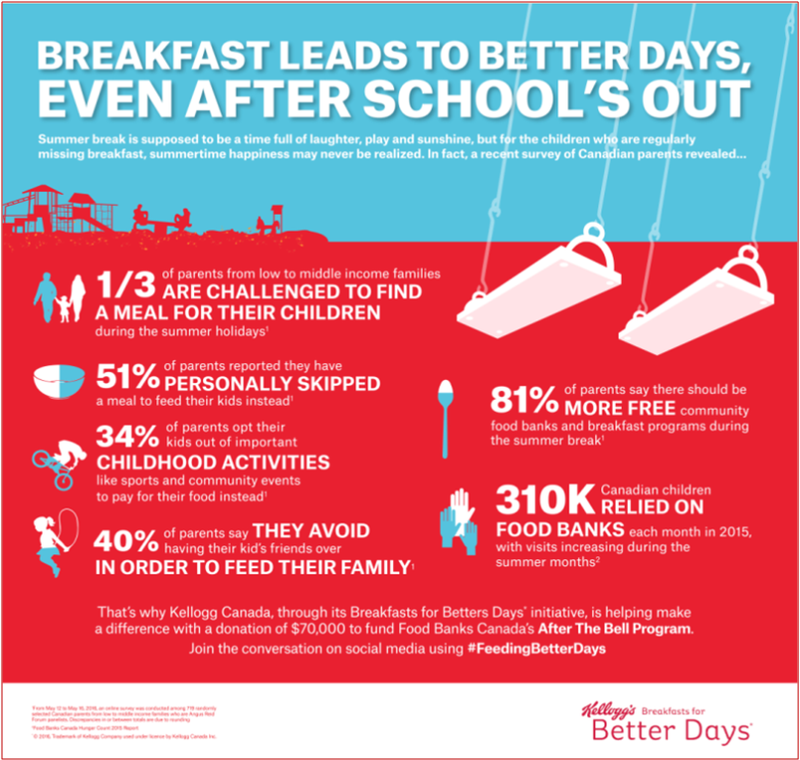
Kellogg’s Breakfasts for Better Days: #FeedingBetterDays
Starting the day with a nutritious breakfast is just as important during summer vacation as it is during the school year! That’s why we created this infographic to help promote Kellogg’s Summer Hunger program, part of the brand’s Breakfasts for Better Days initiative, which shines light on the importance of breakfast for children and supports breakfast partners across Canada.
We create infographics at Strategic Objectives to gain optimal traction. Here are some How To Tips:
- Think problem, solution – provide useful information
- Give original, proof-point stats
- Keep it short – avoid unnecessary jargon
- Keep it clean – structure your information, make it easy for the eye to follow from one point to the next
- Use colour and strong graphics to illustrate your text
- Highlight key points, such as important stats, with larger text
- Prominent branding can be a turn off that inhibits third party pick up. Be discrete with your logo size and placement
Does your brand need some imaginative, engaging storytelling? Please contact us. We’d be delighted to set up a consult.